
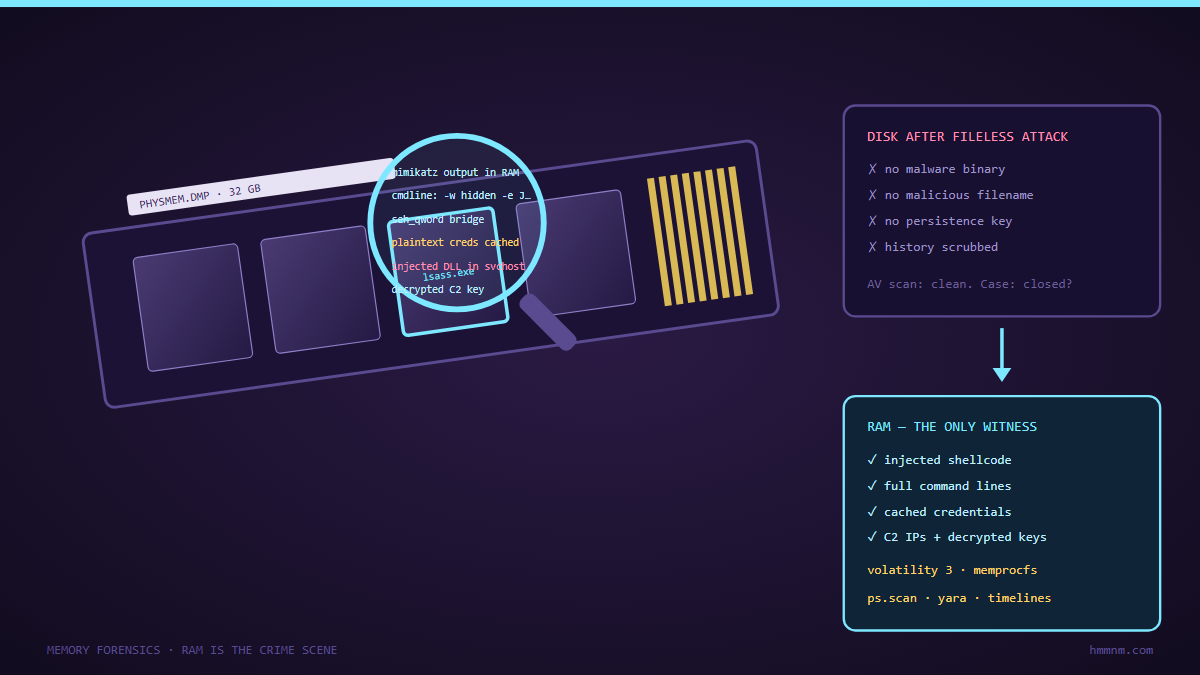
Most of what decides an incident investigation never touches the disk: injected shells in memory, decrypted payloads, credentials cached by the OS, the injected code inside a legitimate process, and the attacker’s tools that were run entirely in RAM and deleted after use. A modern memory-forensics workflow pairs Volatility 3 (structured plugin analysis: processes, networks, tokens, injections) with MemProcFS (mounting the physical-memory dump as a virtual filesystem so you can grep, YARA-scan, and inspect the Windows object namespace with normal tools). The workflow that wins cases is: acquire fast and safely, triage with automated plugins, confirm with targeted filesystem-level inspection, and correlate against disk artifacts — because the fileless decade made RAM the only place the full story still exists.
An incident responder’s oldest frustration: the EDR says a PowerShell process spawned from Word, made a network connection to an unlisted IP, and then vanished. The disk image is pristine — no malware written, no persistence keys, nothing quarantined but a macro-laden document that “looks clean now.” Where did the attack actually live? In memory. It was compiled in memory, executed in memory, and its configuration, decryption keys, and C2 addresses were sitting in RAM the whole time.
Memory forensics grew from a niche skill into the core of incident response for one reason: attackers moved off disk. Fileless and LOLBin-heavy intrusions, criminals shoving reflective DLL injection into signed binaries, and ransomware crews decrypting their payloads only inside a victim process all share one property — disk shows you almost nothing. This article lays out the modern workflow end-to-end: how to acquire memory without destroying it, how Volatility 3 and MemProcFS divide the labour, what the highest-value artifacts are, and how to fuse RAM findings with disk evidence into a timeline that survives scrutiny.
Why Memory Evidence Beats Disk Evidence More Often Than Not
The list of artifacts that exist only in RAM keeps growing:
- Injected code regions inside legitimate processes — the definitive proof that svchost or explorer was hollowed, not merely “suspicious”
- Decrypted payloads — packed programs decrypt themselves in memory; the disk copy stays encrypted garbage
- Plaintext credentials — LSASS holds live logon sessions; the OS keys cached credentials, browser session tokens, and Kerberos tickets in RAM
- Process-parent lies and thread starts — spoofed PPID and process arguments carved into PEB structures expose what cmdlines claimed versus what actually executed
- Network state that never hit a log — the full TCP/UDP table including short-lived C2 beacons, often with the owning process mapped
- Kernel rootkits and DKOM — hidden processes and drivers that disk and live-EDR both miss on a tampered host
That last line matters for acquisition choice: on a compromised host, even the live tooling can be lied to. The kernel that enumerates processes for your EDR console is the same kernel the attacker may own. A raw physical-memory capture plus offline analysis remains the only vantage point the attacker has already burned no longer — it’s a photograph of the crime scene, taken after the fact, that rootkits can’t edit retroactively.
Step 1: Acquisition — The Part Most Teams Get Wrong
Acquisition mistakes destroy evidence faster than attackers do. The rules:
- Prefer hardware/agent-based capture over anything that runs heavy code on the target. Live capture tools allocate memory, and their own footprint perturbs the very artifacts you’re after. Hardware DMA capture is the forensic gold standard; a pre-deployed, lightweight acquisition agent (many EDR platforms now support
memdumpcollection) is the practical middle road. - Order of volatility applies to hosts as well as artifacts. Craft your host sequence to catch live decryption and C2 first — RAM before disk, always; and if only a few hosts can be captured before the adversary notices containment, pick the one showing active beacons, not the patient zero you already understand.
- Don’t reboot “to be safe.” Rebooting is evidence destruction: injected code, clipboard contents, and unlogged network state evaporate. Many teams have lost the entire fileless chapter of an incident to a well-meaning reboot.
- Hash the dump at acquisition, chain-of-custody from the start. A memory image you can’t defend procedurally won’t survive a courtroom or even a vendor dispute.
- Capture the accompanying context: the running process list from the live system (
tasklistoutput, EDR process tree), system uptime, and firewall state — all become correlation anchors for the offline analysis.
| Method | Perturbation | Speed | Practical fit |
|---|---|---|---|
| Hardware DMA reader | None on host | Fast | Labs, legal cases |
| Agent-based live dump | Low | Moderate | Enterprise IR |
| Hypervisor snapshot | None (frozen VM state) | Instant | Cloud/virtualised estate |
dd of /dev/mem variants |
High, often blocked | Slow | Last resort |
| Crash-on-purpose (NMICrash) | Moderate | Fast | Windows-only fallback |
Hypervisor snapshots deserve a note: for cloud estates they are the cheapest defensible acquisition — freeze the VM, snapshot, extract the .vmem/.raw, unfreeze or keep forensating offline. In 2026, more casework starts from a cloud snapshot than from a USB acquisition tower, and the workflow that follows is identical.
Step 2: Triage with Volatility 3 — The Plugin Ladder
Volatility 3 is the structured-analysis engine: it parses the raw dump into operating-system objects and answers the standard first-hour questions. A field-tested triage order:
windows.info— confirm profile, uptime, and dump integrity. Everything downstream depends on this succeeding cleanly.windows.pstree/pslistvspsscan— the discrepancy set is your first hidden-process detector:pslistwalks the kernel’s view (what rootkits may have unlinked),psscancarves _EPROCESS objects from pool memory. Processes present in scan but absent from list are DKOM red flags.windows.cmdline— the actual executed command with arguments for every process; combined with PEB-based argument carving, exposes spoofed vs real command lines.windows.netscan— full TCP/UDP tables with owning process. C2 beacons, lateral-movement sockets, and hidden listeners appear here.windows.handles/windows.dlllist— which modules each suspicious process loaded; unsigned-or-on-disk-no-longer DLL paths are injection candidates.windows.malfind— the signature plugin: regions marked executable with a PE header or shellcode patterns mapped inside processes that should have no such memory. This is the injected-shell warrant.windows.privileges/windows.envars/ token inspection — privilege escalation and stolen-token evidence.windows.cachedump/windows.hashdump/ LSA extraction — credential impact assessment (lab-bound only: these contain live secrets, treat dumps accordingly).
The plugin ladder’s purpose is hypothesis-building: pstree gives you the suspicious PID, netscan ties it to an address, malfind proves code injection, cmdline explains intent. Each answer feeds the next plugin choice — memory triage is a decision tree, not a script run start-to-finish.
Step 3: Deep-Dive with MemProcFS — Mount the Dump as a Filesystem
Volatility answers structured questions; MemProcFS changes the game by mounting the physical-memory dump as a virtual filesystem. The dump becomes browsable: processes are directories, their address spaces are files, and standard tools (grep, strings, yara, your hex editor, your scripts) suddenly work directly against memory.
What this unlocks in practice:
name/directories for every process — walk the process’s virtual address space file-by-file, extract mapped DLLs and suspicious regions as files for static analysis in your normal pipeline.- Native YARA over the whole dump or per-process — scan every process for your threat-intel pack in one action; retro-hunt across the image for the ransomware config pattern once you know what it looks like.
sys/virtual files exposing parsed forensic data — processes, threads, handles, and kernel modules rendered as both human-readable text and JSON, which turns ad-hoc triage into scriptable pipelines.- Direct filesystem-forensics vocabulary — orphaned/hidden drivers, pool-tag carving, and object-directory walks that used to require custom plugins.
- Layered analysis alongside disk images — MemProcFS can mount the disk image simultaneously and correlate: the file the injector dropped (disk) against the memory region it mapped (RAM) against the prefetch/USN record of first execution (disk) — the same incident, three vantage points, one browser.
The practical division of labour: Volatility for the standard first-hour ladder, MemProcFS the moment triage produces a “now look closer at this process” hypothesis. Grep-ability is the superpower — most config-carving (C2 domains, keys, campaign IDs) in real cases ends up being a MemProcFS grep over a specific process directory with a pattern derived from one known sample.
Step 4: The Artifact Fusion — Building the Timeline That Matters
Memory artifacts earn their keep when fused with disk and log evidence:
- Injected code + dropped file: malfind region hashes matched against the dropper on disk prove execution, not just presence.
- Decrypted C2 config (RAM) + firewall logs (net): the beacon schedule you extracted explains the log pattern no one could interpret.
- LSASS-access evidence + authentication logs: which credentials the attacker could have dumped versus which were actually reused elsewhere — the difference between “rotate everything” and a scoped response.
- Process carve (RAM) + Prefetch/AmCache (disk): fileless execution has no prefetch record — the absence corroborates memory-only execution.
- ** clipboard/keystroke residue + user-context**: in intrusion-of-people cases and insider matters, session-cached content answers questions nothing else can.
Report the fusion, not the fragments. The deliverable that lands with legal, insurers, and executives is the timeline: “at 03:14 the injected thread inside WINWORD beaconed to X; at 03:16 the credential dump tool ran purely in memory (artifact: pool-tag carve, no disk write); at 03:19 domain-admin ticket appeared in LSASS.” Every claim carries its artifact source — RAM, disk, or log.
The 2026 Workflow Reality Check
Three shifts worth internalising:
- EDR telemetry and memory forensics are converging — many platforms now capture targeted memory regions on detection automatically. That shrinks caseload but not skill need: someone still has to interpret the captured regions, and the acquisitions fail exactly when rootkits are most active.
- Acquire at the first indicator — it beats everything after the fact. The best memory evidence comes from hosts captured while the intrusion was live. Response playbooks that wait for a “confirmed compromise” threshold consistently capture post-cleanup memory — i.e., nothing.
- Linux and Mac are no longer niche chapters. Volatility 3’s Linux/macOS support plus MemProcFS’s Linux support mean the same workflow runs against cloud Linux fleets — where most enterprise estate now lives.
FAQ: Memory Forensics Workflow
What’s the difference between Volatility and MemProcFS?
Volatility 3 runs structured plugins that parse specific Windows/Linux/macOS objects and answer specific questions — process list, network table, injected regions. MemProcFS mounts the memory dump as a virtual filesystem so you can browse, grep, and YARA-scan processes and kernel memory with ordinary tools. In practice: Volatility for the automated triage ladder, MemProcFS for hypothesis-driven deep dives, config hunting, and cross-referencing with mounted disk images.
When should I capture memory versus just imaging disk?
Always memory first when live compromise is suspected — rebooting or pulling the plug destroys RAM evidence that often constitutes the only proof of fileless execution, injected code, decrypted configurations, and cached credentials. Disk imaging never recovers those. If you must choose with limited acquisition capacity, take RAM from the actively-beaconing host and disk from the patient-zero host.
Can memory forensics detect fileless malware?
Yes — it’s the primary way. Fileless malware lives in RAM: injected regions inside legitimate processes (Volatility’s malfind pattern), reflective DLL loads with no disk backing, PowerShell assembly execution inside .NET CLR heaps, and kernel modules absent from the module list. The disk may be spotless; those artifacts persist in the dump precisely because the attack required them in memory to run.
How do rootkits hide from memory analysis?
Advanced kernel rootkits unlink processes from kernel lists (DKOM), unhook and re-hook system-call paths, and hide drivers. Volatility counters by carving _EPROCESS structures from pool memory independently of the kernel’s linked list, and by comparing multiple enumeration sources. Footprint-free offline analysis of a physical dump is the strongest counter-technique, because it inspects kernel memory the attacker can no longer change.
Is it legal to dump LSASS or read credentials from memory?
Legality and proportionality depend on jurisdiction, ownership of the systems, and the investigation’s purpose — analysis of your own estate during incident response is normal practice, while capturing personal data from other parties’ users raises data-protection obligations. Treat extracted credential material as highly sensitive: restricted storage, case-bound handling, and deletion after rotation-and-remediation make both the legal and practical risk manageable.
How much RAM can I realistically analyse?
Modern acquisition is commonly 16–128 GB per host. Volatility plugin runtime scales with size and plugin type (netscan and handles are the heavy ones); MemProcFS handles large dumps well because it lazily parses on access rather than eagerly. Practical approach: run the fast ladder on everything, deep-dive only the hosts triage implicates, and use YARA across full dumps for threat-wide retro-hunts.
Key Takeaways
- RAM is where fileless attacks actually live — injected code, decrypted payloads, live credentials, and hidden network state exist only there. Capture memory before anything else, and never reboot a live-compromised host to “be safe.”
- Acquisition quality caps analysis quality: prefer hardware/agent-based or hypervisor snapshots over heavyweight live tools, hash at capture, and record the live context (process list, uptime) as correlation anchors.
- Run the Volatility ladder for triage: info → pstree/pslist-vs-psscan discrepancy → cmdline → netscan → handles/dlllist → malfind → privileges → credential extraction, each answer feeding the next question.
- Switch to MemProcFS the moment you have a hypothesis: mounting the dump as a filesystem makes grep, YARA, per-process directory walks, and disk-memory correlation feel like normal filesystem forensics — this is where configs, keys, and campaign IDs actually get found.
- Report fused timelines, not fragments: pair every RAM claim with its disk or log corroboration (or its telling absence, like no-prefetch for fileless execution) — that fusion is what survives legal, insurer, and executive scrutiny.
References
- Volatility 3 documentation and plugin reference — structured memory-analysis framework
- MemProcFS (Ulf Frisk) — mounting physical memory as a virtual filesystem
- Volatility Foundation — windows.pstree, psscan, netscan, malfind plugin family
- NIST SP 800-86 — Guide to Integrating Forensic Techniques into Incident Response (order-of-volatility doctrine)
- SANS FOR508 — advanced incident-response and memory-forensics methodology
- Internal: The First 24 Hours of a Ransomware Attack — where memory capture slots into the hour-zero response plan
{“@context”:”https://schema.org”,”@type”:”FAQPage”,”mainEntity”:[{“@type”:”Question”,”name”:”What is the difference between Volatility and MemProcFS?”,”acceptedAnswer”:{“@type”:”Answer”,”text”:”Volatility 3 runs structured plugins that parse operating-system objects and answer specific questions — process lists, network tables, injected regions. MemProcFS mounts the memory dump as a virtual filesystem so you can browse, grep, and YARA-scan processes and kernel memory with ordinary tools. Use Volatility for the automated triage ladder and MemProcFS for hypothesis-driven deep dives, config hunting, and correlating memory with mounted disk images.”}},{“@type”:”Question”,”name”:”When should I capture memory versus just imaging disk?”,”acceptedAnswer”:{“@type”:”Answer”,”text”:”Always capture memory first when live compromise is suspected. Rebooting or pulling the plug destroys the only proof of fileless execution, injected code, decrypted configurations, and cached credentials — evidence disk imaging can never recover. With limited capacity, take RAM from the actively beaconing host and disk from the patient-zero host.”}},{“@type”:”Question”,”name”:”Can memory forensics detect fileless malware?”,”acceptedAnswer”:{“@type”:”Answer”,”text”:”Yes — it is the primary way. Fileless malware lives in RAM: injected regions inside legitimate processes, reflective DLL loads with no disk backing, .NET assemblies executed inside PowerShell, and hidden kernel modules. The disk may be spotless while all of these remain visible in a physical-memory dump.”}},{“@type”:”Question”,”name”:”How do rootkits hide from memory analysis?”,”acceptedAnswer”:{“@type”:”Answer”,”text”:”Kernel rootkits unlink processes from kernel lists, re-hook system-call paths, and hide drivers. Analysis counters this by carving process structures from pool memory independently of kernel lists and comparing multiple enumeration sources. Offline analysis of a physical dump is the strongest counter-technique because the attacker can no longer change what is already captured.”}},{“@type”:”Question”,”name”:”Is it legal to dump LSASS or read credentials from memory?”,”acceptedAnswer”:{“@type”:”Answer”,”text”:”It depends on jurisdiction, system ownership, and investigation purpose — analysing your own estate during incident response is normal practice, while personal data raises data-protection obligations. Treat extracted credentials as highly sensitive: restricted storage, case-bound handling, and deletion after rotation keep legal and practical risk manageable.”}},{“@type”:”Question”,”name”:”How much RAM can I realistically analyse?”,”acceptedAnswer”:{“@type”:”Answer”,”text”:”Modern acquisitions run 16 to 128 GB per host. Volatility scales with plugin type (network and handle enumeration are heaviest); MemProcFS handles large dumps well by parsing lazily on access. The practical pattern: run the fast ladder on every host, deep-dive only implicated systems, and use YARA across full dumps for retro-hunting.”}}]}
Related Reading
Part of our Cyber Threat Intelligence & CVE Analysis: The Complete Guide series.
- 10 Essential Tips for Aspiring Ethical Hackers
- 100 Network Topics to Revise Before Your Interview
- How Much Does a Penetration Test Cost in 2026? Pricing Guide + Calcula